
7.0/9
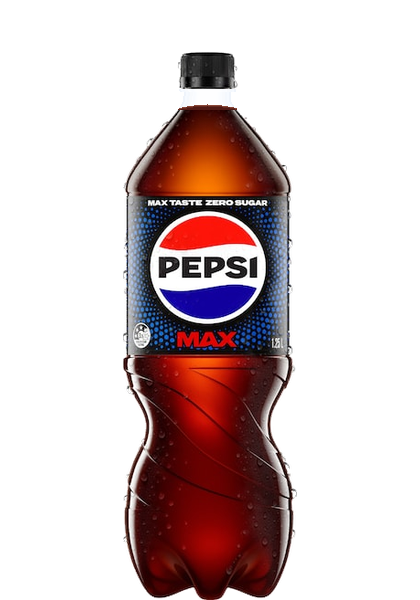
Ranked #1 in overall liking across the panel. Placed in all 5 testers' post-evaluation top-three selections, with individual scores between 6 and 8.
A comprehensive benchmark of 10 zero-sugar colas sold across Australian supermarkets. Featuring 50 ratings from a 5-tester panel, calibrated pH readings, sodium levels, ingredient breakdowns, and annual grocery spend calculations.
Retail pack references · packaging can differ from the tested bottles
5-tester panel · unbranded serving · Australian retail packaging.
Colas positioned by overall liking mean across 5 independent testers (1 to 9 scale).
All products evaluated in identical unbranded serving conditions. Ratings reflect this 5-tester panel; chemical, sodium, and nutritional data reflect verified Australian retail packaging.
Each numbered point matches the product key. Choose a vertical measure to compare the same laboratory pH readings with sodium or blind-panel scores.
| Cola | Laboratory pH | Sodium (mg/100 mL) | Mean liking | Sweetener system |
|---|---|---|---|---|
| Diet Coke | 2.67 | 1 | 4.4 | Aspartame (951) + Ace-K (950) |
| Coca-Cola Zero Sugar | 2.69 | 4.1 | 4.8 | Aspartame (951) + Ace-K (950) |
| Coca-Cola Zero Sugar Zero Caffeine | 2.47 | 4.1 | 3.2 | Aspartame (951) + Ace-K (950) |
| Pepsi Max | 2.44 | 13 | 7.0 | Aspartame (951) + Ace-K (950) |
| Regal No Sugar Cola | 4.15 | 30 | 3.2 | Aspartame (951) + Ace-K (950) |
| LA Ice No Sugar Cola | 2.65 | 15 | 5.0 | Cyclamate (952) + Ace-K (950) + Sucralose (955) |
| Que Cola No Sugar Cola | 2.75 | 15 | 3.6 | Cyclamate (952) + Ace-K (950) + Sucralose (955) |
| Black & Gold Cola Zero Sugar | 2.53 | 13 | 3.8 | Cyclamate (952) + Ace-K (950) + Sucralose (955) |
| Woolworths Cola Sugar Zero | 2.54 | 6 | 3.0 | Cyclamate (952) + Ace-K (950) + Sucralose (955) |
| LA Maxi Ice Cola | 2.64 | 13 | 5.0 | Cyclamate (952) + Sucralose (955) + Ace-K (950) |
Each dot represents one tester's score on a 1 to 9 scale. The diamond marker indicates the 5-tester panel mean. Filter by metric or tester to inspect score distributions across all 10 products.
Select a tester to isolate their ratings across all 10 colas and re-sort the table. Other scores remain visible in muted tone.
Ranked #1 in overall liking across the panel. Placed in all 5 testers' post-evaluation top-three selections, with individual scores between 6 and 8.
Both products produced an identical 5.0/9 panel mean. However, individual scores ranged from 2 to 8, illustrating polarised tester responses.
Selected as the #1 favourite by one tester in post-test rankings, despite receiving a lower panel average of 3.6/9 across all five testers.
Pre-test declared habits, predicted favourites, and post-evaluation selections for each of the 5 panel testers. Select any product name to open its specifications.
Preferred cola when drinking: Coca-Cola Zero Sugar
Regular drink: Pepsi Max Vanilla / Coca-Cola Zero Sugar
Regular drink: Coca-Cola Zero Sugar
Regular drink: Que Cola No Sugar Cola
Regular drink: Pepsi Max
A tester's highest numerical score and their post-test #1 selection reflect separate evaluation prompts. Profiles represent the 5 participants in this benchmark.
All 10 samples were evaluated by each participant. Serving order was uniform across testers rather than counterbalanced.
Before tasting, panellists ranked all 10 colas based on brand reputation. In unbranded double-blind evaluation, participants were unaware of product identity, code mappings, or serving order, evaluating samples independently without discussion.
| Cola | Expected Rank | Blind Liking Rank | Mean Liking | Rank Delta |
|---|---|---|---|---|
| Diet Coke | #4.6 | #5.5 | 4.4 / 9 | -0.9 |
| Coca-Cola Zero Sugar | #2.0 | #4.5 | 4.8 / 9 | -2.5 |
| Coca-Cola Zero Sugar Zero Caffeine | #6.4 | #7.2 | 3.2 / 9 | -0.8 |
| Pepsi Max | #1.6 | #2.0 | 7.0 / 9 | -0.4 |
| Regal No Sugar Cola | #7.4 | #7.1 | 3.2 / 9 | +0.3 |
| LA Ice No Sugar Cola | #5.0 | #4.6 | 5.0 / 9 | +0.4 |
| Que Cola No Sugar Cola | #7.0 | #6.4 | 3.6 / 9 | +0.6 |
| Black & Gold Cola Zero Sugar | #8.8 | #6.4 | 3.8 / 9 | +2.4 |
| Woolworths Cola Sugar Zero | #6.8 | #7.0 | 3.0 / 9 | -0.2 |
| LA Maxi Ice Cola | #5.4 | #4.3 | 5.0 / 9 | +1.1 |
Testers selected aftertaste descriptors from a standardised list following each sample. Frequencies indicate total mentions across all 50 evaluations.
“Artificial sweetener” was recorded in 19 of 50 evaluations; “clean / neutral” was recorded in 15 of 50. Multiple descriptors could be selected per sample.
| COLA (RANK) | Clean / neutral | Sweet | Artificial sweetener | Bitter | Metallic | Medicinal | Lingering | TOTAL |
|---|---|---|---|---|---|---|---|---|
#01Pepsi Max | 1 | 3 | 1 | · | · | · | 2 | 7 |
#02LA Maxi Ice | 2 | 2 | 3 | · | · | · | · | 7 |
#03LA Ice | 2 | 2 | 2 | · | · | 2 | 1 | 9 |
#04Coke Zero | 3 | 1 | 1 | · | 1 | · | · | 6 |
#05Diet Coke | · | · | 3 | 1 | · | · | · | 4 |
#06Black & Gold | 2 | · | 1 | · | 1 | · | · | 4 |
#07Que Cola | 3 | · | 2 | · | · | · | · | 5 |
#08Coke Zero CF | · | · | 2 | 1 | · | 2 | 1 | 6 |
#09Regal | 1 | · | 1 | · | 1 | 1 | · | 4 |
#10Woolworths | 1 | 2 | 3 | 1 | 1 | 2 | 1 | 11 |
In sensory science, Mean Drop shows the observed mean liking difference in overall liking when sweetness or fizz deviates from “Just Right”.
Can budget supermarket colas ($0.87 to $1.15/L) realistically replace a $3.04 to $3.60/L Coca-Cola or Pepsi habit? Here is what the empirical sensory and chemical data revealed.
Beat Coca-Cola Zero Sugar in blind tasting.
Manufactured by Refresco in Victoria, this $2.30 / 2 L bottle achieved Rank 2 and 3 on the panel, outscoring Coca-Cola Zero Sugar (4.8/9). It also delivered +47.8 g net mass surplus (~+48 mL at ~1.00 g/mL density).
Low carbonation, but one panellist's #1 favourite.
All 5/5 testers found Que Cola too flat, and 4/5 found it under-sweetened. Yet Tester 01 picked it as their single favourite cola of the entire test. Mild, divisive, but very cheap ($1.15 / 1.25 L = $0.92/L).
Lacks acidic bite with 30× the sodium of Diet Coke.
Despite ALDI's strong reputation for private label products, Regal ranked 9th of 10 ($1.09 / 1.25 L = $0.87/L). Laboratory testing revealed an unusually high pH of 4.15 (lacking crisp acid bite) and 30 mg sodium per 100 mL.
Rated lowest on panel liking with harsh aftertaste.
Finished dead last (Rank 10 of 10) despite its competitive $1.15 / 1.25 L ($0.92/L) price point. 0/5 testers rated sweetness just right, 3/5 rated it flat, and panellists cited medicinal aftertaste. The only cola using preservative 202 (potassium sorbate).
Filter products based on taste preference criteria (sweetness, carbonation, caffeine status) calculated against the benchmark dataset.
Calculated match scores reflect this 5-tester benchmark dataset and stated product specifications.
Specifications for each tested Australian retail product, including sweetener systems, preservative additives, sodium, lab pH, and verified net liquid mass (deducting calibrated bottle-family tare weights: 35.2 g to 40.7 g for 1.25 L moulds, 47.2 g for 2.0 L moulds; ~1.00 g/mL density). Ties on panel mean are resolved by post-test top-three selections, followed by aftertaste liking.
Directly compare any two Australian no-sugar colas across panel scores, 6-axis sensory profiles, individual tester ratings, and laboratory measurements.
Precision scales recorded unopened bottle gross mass, with verified dry packaging tare deducted to establish net liquid mass in grams. Zero-sugar colas approximate water density (~1.00 g/mL), meaning net liquid mass closely approximates fluid volume in millilitres without claiming direct pycnometric volume measurement. In this single-bottle sample, 8 of 10 colas deliver surplus mass (+1 g to +47.8 g). Under Australia's National Trade Measurement Regulations, the Average Quantity System (AQS) establishes a Tolerable Negative Error (TNE) reference threshold (19 mL for 1.25 L and 30 mL for 2.0 L) for commercial packaging runs. While formal AQS compliance applies across entire production lots rather than single retail bottles, all 10 measured samples fell comfortably within this reference tolerance window.
Nominal capacity declared on-pack is 1.25 L (1250 mL). Precision scale reading of the full unopened bottle was 1295 g. Deducting the verified empty PET bottle tare weight of 40.7 g (Unique Pepsi Max) establishes that the bottle contained 1,254.3 g of net liquid mass (+4.3 g vs nominal 1:1 mass equivalent, corresponding to an inferred volume of ~1,254.3 mL at ~1.00 g/mL density).
Laboratory measurements and official label disclosures: pH acidity readings, sodium levels, official FSANZ additive numbers, measured container volumes, and nutrition information panels.
Sodium functions as a buffering agent and flavour modifier in zero-sugar formulations. Values range from 1.0 mg / 100 mL (Diet Coke) to 30.0 mg / 100 mL (ALDI Regal).
Average readings from calibrated pH probe testing. Phosphoric acid formulations register near pH 2.44–2.75, providing the characteristic tart bite of dark colas.
Comparing retail price per litre against unbranded blind panel liking exposes products delivering optimal value versus heavy brand tax premiums.
Pareto Value Frontier: The mathematically non-dominated frontier comprises ALDI Regal ($0.87/L, 3.2), Black & Gold ($0.92/L, 3.8), LA Ice & LA Maxi Ice ($1.15/L, 5.0), and Pepsi Max ($3.04/L, 7.0). No competing cola provides equal or higher blind panel liking at a lower price. All other products are Pareto-dominated by cheaper or higher-scoring alternatives.
| Cola | Price per Litre | Shelf Price | Mean Liking |
|---|---|---|---|
| Diet Coke | $3.60/L | $4.50 | 4.4 / 9 |
| Coca-Cola Zero Sugar | $3.60/L | $4.50 | 4.8 / 9 |
| Coca-Cola Zero Sugar Zero Caffeine | $3.60/L | $4.50 | 3.2 / 9 |
| Pepsi Max | $3.04/L | $3.80 | 7.0 / 9 |
| Regal No Sugar Cola | $0.87/L | $1.09 | 3.2 / 9 |
| LA Ice No Sugar Cola | $1.15/L | $2.30 | 5.0 / 9 |
| Que Cola No Sugar Cola | $0.92/L | $1.15 | 3.6 / 9 |
| Black & Gold Cola Zero Sugar | $0.92/L | $1.15 | 3.8 / 9 |
| Woolworths Cola Sugar Zero | $0.92/L | $1.15 | 3.0 / 9 |
| LA Maxi Ice Cola | $1.15/L | $2.30 | 5.0 / 9 |
Supermarket budget and private-label colas retail for substantially less than major multinational brands. Calculated directly from retail bottle pricing ($ per litre × annual consumption volume) for standard 250 mL serves.
Equivalent to 4 to 5 full tanks of automotive fuel, 8 slabs of Australian beer, or around 100 bakery meat pies.
Calculated directly from verified supermarket bottle prices ($/L × selected volume, refreshed October 2026). Major brands: Coca-Cola Zero Sugar ($4.50 / 1.25 L = $3.60/L) and Pepsi Max ($3.80 / 1.25 L = $3.04/L; average $3.46/L). Supermarket budget colas: ALDI Regal ($1.09 / 1.25 L = $0.87/L), Coles Que ($1.15 / 1.25 L = $0.92/L), Woolworths Zero ($1.15 / 1.25 L = $0.92/L), Black & Gold ($1.15 / 1.25 L = $0.92/L), and LA Ice / Maxi Ice ($2.30 / 2 L = $1.15/L; average $0.99/L).
TESTING PROTOCOL & DATA SOURCES
Five adult participants evaluated 10 zero-sugar colas in unbranded sample cups. Findings reflect this specific panel rather than an Australian population study.
Samples were identified by randomised 3-digit reference codes, chilled to uniform temperature, and presented in identical glassware under controlled test conditions. Participants were unaware of product identity, the code-to-product mapping and upcoming serving order, and evaluated samples independently without discussing ratings with one another. Sample preparation and serving personnel were also blinded to code mappings during evaluation sessions.
Overall, flavour, and aftertaste liking were recorded on a standard 1–9 hedonic scale. Sweetness and carbonation were evaluated on 1–5 Just-About-Right (JAR) scales.
Ingredients, nutritional values, volume measurements, and barcode specifications were audited from commercially purchased Australian retail bottles.
Acidity levels (pH) were recorded using calibrated lab probes with triplicate readings averaged across samples under standard laboratory conditions.
Post-sip aftertaste notes were recorded using multi-select category checkboxes to map perceived sensory attributes across formulations.
Study source. Cola Wars Data Package v2.0 · 26 September 2026. The package documentation and QA report set standardized names and IDs and report no unresolved record or join issues.
Nutrition labels. The study package transcribes Australian bottle labels. FSANZ explains why panels show per-serving and per-100 mL values and how additive numbers are used in ingredient statements.
FSANZ · Nutrition information panels FSANZ · Food additive labelling FSANZ · Intense sweetenersCurrent product references. Diet Coke · Coke Zero · Coke Zero CF · Pepsi Max · Regal · LA Ice · Que Cola · Black & Gold · Woolworths · LA Maxi Ice. Pages checked 26 September 2026. Listings and formulations can change by store, location, and time.
Retailer note (ALDI Regal). Tested bottle data reflects the physical September 2026 sample (aspartame 951, Ace-K 950, and sodium benzoate 211). ALDI's current online listing describes a formulation with no artificial sweeteners or added preservatives, indicating that current retail stock or online product information may differ from the tested bottle.